Showing posts with label numbers. Show all posts

Wednesday, August 26, 2015

St Petersburg Paradox

I was having lunch with teacher friend  the other day, and discussing some interesting examples of how statistics and probability can get kind of weird. He loved the Birthday Problem and decided to use it for his class, but was particularly fascinated by the more tricky St Petersburg Paradox.

The problem goes thus: there is a game that costs X dollars to play, which simply involves tossing a coin. You start with a pot $2, and every time the coin comes up heads the banker doubles the pot. As soon as the coin comes up tails the game ends, and you get to walk away with the pot. The question is, how much is a reasonable amount of money X to play the game?

Where the paradox comes in is how statistics defines 'fair'. Usually we calculate the average, or "expected" amount of money to be made from the game, by totalling up all of the possibilities combined with how much we expect to make from them. In this game, we have a 50:50 chance of getting $2 (the first throw being a tail), and then a 1/4 chance of getting $4 (a head, then a tail), then 1/8 chance of getting $8 (heads, heads, tails) and so on. That means we can expect on average $1 from the worst-case scenario (it's $2, and happens half the time, and $2 x 1/2 = 1), and another $1 from the heads-tails scenario ($4 x 1/4 = $1) and so on. This process goes on forever - it's always possible to get more heads - so the average amount we expect to win in this game is $1 + $1 + $1 + .... = infinite money, and that's how much we should apparently spend to play the game.

This obviously doesn't make sense. For a start, you're always going to lose at some point, so it's physically impossible for you to make infinite money no matter how many times you get heads. The problem is that the idea of an expected amount of money depends on the assumption that we want to know what happens in the long run, so it assumes we are playing this game infinitely many times and taking the average. But when we play infinitely many times, we suddenly have access to the end of the rainbow where we're making infinite money - the idea is that infinity is a mathematical construct that we never see in reality. Usually we can deal with it pretty happily without weird things happening, but this is a weird game, and breaks our usual assumptions.

What we can do instead is see what's most likely to happen to our winnings as we keep playing. For a single game, it's pretty clear that most of the time we'll win either $2 or $4 (with a 50% and 25% chance respectively), and occasionally $8 (12.5%) but we're not likely to win much more than that. If we play two games, then our worst case scenario is that we'll win $4, with a 1/2 x 1/2 = 1/4 chance. There are two ways we can win $6 - we can win $2 then $4, or $4 then $2. Both of these options have a 1/2 x 1/4 = 1/8 chance of happening, so overall we've got 1/4 chance of that happening too. We can calculate the other possibilities that way too - obviously we have to stop at some point, but we can go far enough to get a decent idea. We can then keep going and see what happens when we play more and more games in a row, and getting bigger jackpots gets more and more likely.

Of course, the best way to do this is with a computer to avoid all those pesky calculations. Here is a graph of the possibilities over the course of 100 games:

Lighter colours represents where a possibility is relatively likely, and dark colours where it is unlikely. You can see little waves towards the top-left of the graph - this is where after a few games there's a small but decent chance of getting a single big win which overwhelms all of the other winnings. Especially when not many games have been played, it's more likely that you'll get a single big win and a lot of small wins than multiple medium-sized wins.

The blue line represents the median average win, and is surrounded by red interquartile lines - the idea is that half of the time, your winnings per game after a certain number of games will be between the two red lines. For example, after 50 games, it's 50-50 whether your average winnings are above or below $8.20 (the median), and half the time your average winnings will be between $6.12 and $12.44. So if you paid only $6 a game, you're probably doing pretty well at this point!

The most important part of this graph is that these numbers are going up as we keep playing games, meaning that the game becomes more and more reliably profitable. Further along the graph, the computer can no longer keep track of the higher numbers of winnings (which is why the red line disappears) so we need to find another way to work out what happens with more than 100 games. Using results cited in this paper, we can actually estimate the median winnings as

$2.55 + log2(number of games)

So after 100 games, $9.20 looks like a reasonable price - paying that price, half the time we'll end up ahead, the other half we won't. Note that the distribution is what statisticians call skewed - even though we only come out ahead half the time after 50 games, the "good" half is a lot better than the "bad" half is bad.

Let's say that we really want to milk this game for all it's worth, and we've found a game online that we can make our computer play for us. If we can play a million games a second, and leave our computer running for a year, that's over 30 trillion games. If we put that into our formula, we get a median win of $47.40 per game. If we paid that much per game to play, we'd expect to lose a lot of money at the start but make it back as the games wore on and we got more and more jackpots, breaking even after a year. However, if we only paid $9.20 as before, we'd expect to be doing ok by 100 games (i.e. after 100 microseconds), and by the time our program had been running for a year, we'd be looking at profits around $1200 trillion dollars - 700 times Australia's GDP and enough to basically rule the world.

Unfortunately, no casino will ever host this game, online or otherwise, for exactly this reason. Sooner or later, the house will always lose.

Friday, July 25, 2014

Fruits of procrastination

Winter tends to be a bit slow for me, in terms of work and productivity at least. It gets that little bit harder to concentrate, or stay motivated on tasks that are... the less fun parts of my job as a research scientist.

To that end, I thought I'd keep this blog alive by sharing some of my afternoon's procrastination, which I thought was kind of cool and a real reflection of how even now in 2014 we're still a fair way away from 'science fiction' in a lot of our endeavours. Artificial intelligence is a big one of these - we've achieved a lot since electronic computers hit the scene not-so-long ago - but our imaginations at least for now far outstrip what we've been able to do. Exactly because it excites people's imaginations, progress is heavily trumpeted - and make no mistake, some cool things have been done, especially in AI-friendly environments such as strategy games (chess is probably the most obvious example here).

Unfortunately, things get much more difficult for AIs when we go from simple games where the options are finite and often manageable to more realistic real-world tasks where there are numerous things that need to be coordinated at once - something that our human brains are evolved to deal with but computers have no such base to work from. The programmer can of course give the computer insights as to how humans would deal with things, and sheer processing speed can help make up some of the difference - any first-person computer gamer can attest to AIs being potentially very skilful (though often easily fooled by unusual strategies).

My afternoon's procrastination has involved looking at RoboCup - a series of competitions based around the game of soccer (or football, depending where you're from). The AIs actually look reasonably clever in the simulated 2D version. Keep in mind that to keep some degree of 'realism' each AI player has been given some simulated 'noise' to their sensors so they don't have perfect information, much like players in real life.


Once you get to 3D though, things start looking seriously clunky. Each virtual robot has 22 different joints to control - and it shows. They're very good at doing set combinations of movements (like a set shot at goal, given enough time) but it's not exactly what you'd call graceful...


When you convert this to real life robots, things get even worse. Really the only thing these robots can do consistently well is get up after they've fallen over - and after watching this video for any length of time you'll understand why this is a vital necessity:


The stated goal of RoboCup is that "by the middle of the 21st century, a team of fully autonomous humanoid robot soccer players shall win a soccer game, complying with the official rules of FIFA, against the winner of the most recent World Cup". At the moment that looks kind of optimistic, but when you consider how far computing came from the earliest personal computers in the 80s to the present, then extrapolate to 30 years in the future, their goal doesn't seem quite so unrealistic.

Tuesday, January 7, 2014

Testing the Bechdel Test

So, recently this article came out showing that of the top 50 movies of 2013, those that passed the Bechdel Test made more money overall at the US Box Office than those that didn't. For those not in the know, the Bechdel Test evaluates whether a movie has two or more named women in it who have a conversation about something other than a man. The test seems simple enough to pass, but surprisingly quite a lot of movies don't! Of the 47 top movies that were tested, only 24 passed the test (and at least* seven of those were a bit dubious). Gravity was understandably excluded from the test because it didn't really have more than two named characters**, and apparently no-one has bothered to test the remaining two.

The article comes with this nifty little infographic:


I've seen a couple of complaints on the web by people saying that this isn't enough proof - the somewhat ingenuous reasoning I saw was that the infographic shows totals and not averages, so can't prove that the average Bechdel-passing film performs better. Though there are more passes (24) than fails (23), the difference is not nearly enough to account for the almost 60% difference in total gross sales. The averages can quickly be calculated from the infographic above - the average passing film makes $176m, and the average failing film makes $116m, still a very substantial $60m difference!

A more reasonable criticism is that it may be possible that things just happened this way by chance. Maybe this year a handful of big films happened to be on the passing side, and if they had failed there'd be no appreciable difference? Well, we can test that as well using the information in the infographic. All we need to do is run what's called a randomisation test - this is where we randomly allocate the 50 tested movies in this list to the "pass", "fail" and "excluded" categories in the same numbers as in the real case (so, 24 passes, 23 fails, 3 excluded). We can use a random number generator to do this, or if you're playing along at home, put pieces of paper in a hat, whatever. We repeat this process a large number of times (I did it 10 million times) and see how often we can replicate that $60m difference between passing and failing films or better by chance alone.


It turns out that when you put your pieces of paper in a hat to make your own test, you'll only be able to beat the actual difference 0.71% of the time, or about 1 in 140 times. This is pretty good evidence that it's not a fluke and that the Bechdel Test really did influence movies' bottom lines this past year. One thing that we can't say based on this is whether this is a direct effect - i.e. that people consciously or subconsciously decided to go watch passing films over failing films. It could be that there is some indirect, or confounding effect, causing this phenomenon. For example, maybe directors who write films that pass the test tend to be better filmmakers in other ways which make people want to watch their films more? Either way, a trend towards more women in substantial roles in films can be no bad thing! (though it's worth mentioning that passing the Bechdel test by no means guarantees a "substantial role", and even failing movies can have their strong points - see this link)


* Having watched Man of Steel, I'd argue that it was pretty dubious too - I think the only non-about-a-man conversations between two women were one-sided one liners (hardly a conversation)... in any case, any feminist points it may have gained were swiftly taken away in my book by the female US Air Force Captain being mostly portrayed like a ditz rather than as a dedicated leader of people required for the rank. More here.
** So I'm told. I haven't watched it yet.

Monday, September 9, 2013

Senate number crunching

For those outside Australia, or for those Australians who are living (or, understandably, hiding) under a rock, we've just had our national elections, at which our all of the seats of our government have been decided and half of the seats in our Senate (the house of review).

Though almost all of the seats in the lower house have been decided, which is normal for election night, the results for the Senate generally take days to weeks to be fully finalised. Though most of the seats are generally worked out fairly quickly - in particular, those seats going to the major parties - the remaining few seats are far less certain.

The use of the Single Transferable Vote system for the Australian Senate means that votes for minor parties go through a convoluted process of 'transfer' from candidate to candidate, which is further complicated by the Group Voting Ticket system and the deals made by minor parties with each other for preferences. What this means is that a party receiving a very small number of votes can obtain a seat in the Senate simply by the snowballing of preferences from other small parties.

This has been particularly apparent in this election, with the current estimated results by the ABC suggesting that as many as 8 seats are likely to go to parties outside of the main three (the Liberal/National coalition, the Australian Labor Party and the Australian Greens), with seats controversially likely to go to members from the Australian Sports Party and Australian Motoring Enthusiasts Party, which only received a tiny fraction of the initial vote. The popular media has already heavily covered these results even though they are still by no means yet certain.

Because of the above complexities, it can take only a small variation in voting to change the result for one or more seats. In this sense, the ABC's estimate is fairly naive: they assume that all voters have voted 'above the line', allowing their preferences to be decided by their chosen party (though this is not so far from the truth, with over 95% of voters generally doing so) and that the final results will be accurately represented by the results that have come in so far (between 50-80% of the vote for each state). Working out what potential bias there may be in the remaining votes is possible to a certain extent, as the voting information includes voting breakdowns for smaller regions (and can be compared with past elections), and some regions are known to have regular skews in their voting patterns.

What I've done here more simply, however, is to look at how much effect there might be in random fluctuations in the remaining votes to be counted. I assumed that the proportions of votes to each party so far were an accurate representation of the electorate's intent - based on those numbers, I randomly generated the remaining expected votes to be counted (based on current enrolment numbers and last election's turnout - around 94% on average).

For Tasmania, for example, my results usually follow the ABC's results - two each of Labor and Liberal senators are elected, one Greens senator, and one from the Palmer United Party are elected as expected. However, in about 4% of cases (for 1000 election runs) a member of the Sex Party is elected instead of the Palmer United candidate, and in a further 1% of cases a third Liberal Party member is elected.

Taking into account the other sources of fluctuation mentioned above adds to this uncertainty in the results - the Geeklections site and the Truth Seeker blog go into much more detail. This only goes to show that surprises are not only possible but likely as the counting continues...

Saturday, August 4, 2012

An abundance of silver

Statistics can be a really useful way to get a feel for when a "strange event" may just be coincidence, and when it is likely to be something more.

For example, sports fans may have noticed that our gold medal tally is less than stellar so far. Another thing that becomes clear when looking at our medal tally (as of 4th August, 9pm) is that though we have a dearth of gold, we have managed to get quite a lot of silver medals! As it stands, we have 16 medals: 1 gold, 10 silver, and 5 bronze. A curious person might wonder whether there's a reason for that - is it just random chance that it happened that way, or is it something else - maybe our Olympians are psyching themselves up too much and falling at the last hurdle to winning gold?

As it happens, there is a way to get an idea of this using statistics! According to legend, in the 1920s a statistician called Fisher wanted to test his friend's boast that she could always tell whether the milk or tea was added to first to the cup. He tested her boast by giving her 8 cups of tea - four with the milk added first, and four with tea. She got every one of these right and Fisher - using a test known to this day as Fisher's exact test - calculated that if she had guessed, she would have had a less than 1 in 70 chance of getting all 8 correct.

We can use Fisher's exact test to work out the probability of getting 10 or more silver medals if there's an equal chance of getting gold, silver, or bronze and we get 16 medals overall. It turns out there are 153 different combinations, and 28 of those involve 10 or more silver medals. Most of these are incredibly unlikely to occur by chance, with the most likely being 3 gold, 10 silver and 3 bronze - this has an 0.4% chance of happening at random!

All together, the chance of getting at least 10 silver medals at random is 1.6%, or about 1 in 60 - almost as unlikely as the lady having a lucky break with her tea drinking! Most scientific literature counts a value of less than 5% as "statistically significant" - meaning that the result is unlikely to have occurred by chance. Of course, this kind of analysis doesn't tell us why it's happening this way, and unfortunately it sheds even less light on how to fix it...

Sunday, June 17, 2012

A day in the life of...

I thought I'd try and give some kind of idea what it is I do every day, without sending everyone to sleep. One of the projects I'm doing right now (hopefully) gives a nice little example!

I'm trying to model how lizards might move through the landscape, in a collaboration with someone who actually knows something about lizards - because there's no point doing modelling if what you're modelling is completely unrealistic!

One current idea I'm working on is the concept that the landscape contains a set number of basking rocks (in this case: 2000, randomly placed in a square kilometre), which every lizard has to have access to in order to survive. So to over-simplify, let's assume that each established lizard has a territory containing one of these basking rocks. Juvenile lizards disperse from their maternal den in order to find their own territory, and we assume that they sprint off in a random direction (they're not very bright), and don't stop until they either find an unoccupied rock or die without a territory. We arbitrarily set the distance they can travel before keeling over to 20 metres. Using this information, we can then generate a map of which rocks are accessible (i.e. within 20 metres) from other rocks, and connect them with lines:


One thing that immediately becomes clear is that there are quite a few rocks that are more than 20 metres away from any other rock - this means that any baby lizard trying to find another territory from there will inevitably die, unless their mother has died (giving up her claim to the maternal territory) and it is the first of its siblings to claim it. Clearly, setting a hard limit for the distance a juvenile can travel has serious implications for survival!

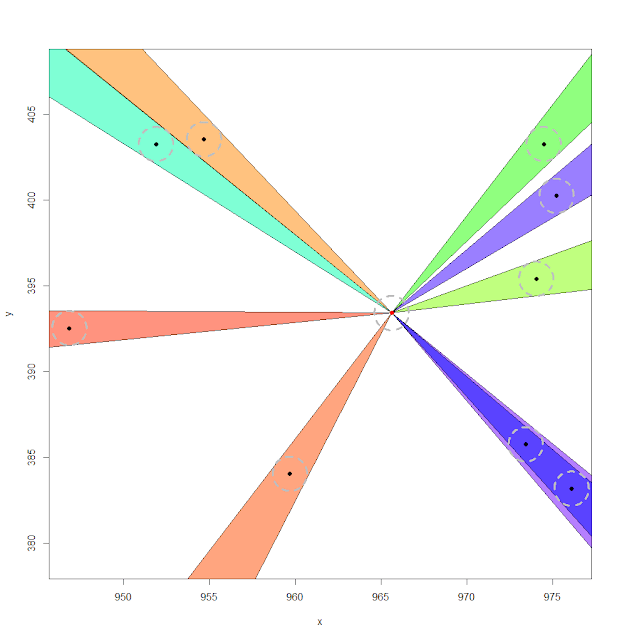
The next problem is to work out how likely a juvenile from a given site is to find another rock (assuming there even are any within 20 metres). As they're not very bright, we assume they'll only stumble across a rock if they travel within one metre of it during their dash to freedom - so we can draw lines that show the range of angles they can travel to find each rock, like below. Though most of them are straightforward to get to, in this example, you can see there is a rock directly behind another rock - so the juvenile will always just choose the first one it reaches. There is also a lot of space between rocks, so a juvenile has to be pretty lucky to be able to establish a territory in the first place!


Things aren't always so straightforward, however. Sometimes a lizard might be lucky and pass one rock just to find another - in the example below, in a couple of places one rock is partially covering the one behind it, but there is a small chance that a lizard will go straight past it and find the rock behind it.


There are more complicated cases again if two rocks are within a metre of each other!

Next time on the mathsy part of the blog, I'm thinking of looking at Snakes and Ladders - and how it gets more complicated when you have to choose between moving multiple tokens - or I could go back to looking at Cribbage like I did a while ago in this post. Any thoughts?

Saturday, March 10, 2012

Ask me

When I was in the midst of writing this blog, I got a surprising amount of interest from friends about a few of my numbers-themed posts. A few of my ideas and thoughts in this section have tapered off (as evidenced by my "Part 1" posts) but I'm keen to get some going again if anyone wants me to explore the intricacies of Pass the Pigs, Cribbage, or anything else - if there's something that I can (relatively quickly) explore using the power of numbers, then post an idea in the comments thread. I'd love to see your thoughts!

Otherwise, most likely I will be posting in this thread sometime soon about my thoughts on choosing teams for fantasy AFL games, as the season is coming up and my good friend Oz will no doubt be applying pressure for me to get my team organised...

Monday, June 6, 2011

Distractions

It's been pointed out I spent all of May without posting!  I suspect there will be much more of this neglect to come as the thesis reaches crunch point.  There is a light at the end of the tunnel, but even now in what I hope are the dying months of the thesis it still seems such a long way away, especially when I'm surrounded by such talented people who clearly know what they're talking about.  Even now, after four years, I feel like I don't know what I'm talking about, and somehow I'm supposed to write hundreds of pages worth of material by the end of this year!

I've suspected throughout the course of the thesis that I'm not really cut out for long-term projects - I think I have some kind of academic ADHD in which I find a problem really exciting but get bored and want to move onto something else before too long.  This kind of short-term obsession is a reason I write posts about random things like analysing cribbage hands or Pass The Pigs - because I find them really, really exciting and interesting... for a while.  Then I find something else and forget about what I was doing before!

It's been really hard to stay excited about the same project when there is so much else going on.  I've heard some people say that doing your PhD is the most rewarding part of your whole academic career - I can honestly say that I really hope not.  While I have learnt a hell of a lot which I am sure will place me in good stead for future jobs etc, it has been one of the most self-esteem crushing, depressing and difficult periods of my life.  I suspect once I find my niche I'll be a lot happier with my lot in life, but suffice it to say I never want to do a PhD ever, ever again!  Having said all that, it is nice to see the work I've been doing over the last few years finally start to come to fruition.

Anyway, now I've had my three paragraphs of emo, these are some of the things I would probably be playing with if I weren't trying to concentrate on my thesis:


There is a thriving community of people out there who spend their time on something called tool-assisted speedruns.  Basically, they use whatever means necessary in order to complete a game as fast as is physically possible - way faster than a human could ever do by themselves.  This involves things like exploiting the hell out of whatever glitches happen to exist in a game, using emulators to slow down the game to get that perfect jump, saving the gamestate before a difficult point and doing a section time and time again until you get it absolutely perfect, and pausing the game for a few hundredths of a second before coming across a difficult enemy just so they behave in a way (based on the random number generators in the game) which means you can get past them faster.  I'd love to spend some time writing computer code to try and optimise some of this stuff and make it even faster - people have already written relatively simple AIs for Super Mario Brothers that work really well:


Another thing I'd like to do is work out where the hell all these pink Nissan Micras are coming from.  If you don't know what I mean, perhaps this will refresh your memory:


I'm starting to see them everywhere!  I'm starting to think I should take a leaf out of the book of the ecologists I work with and do some experiments to work out how quickly their population is increasing - so I know how long it will take before we're all overrun with them.

One non-thesis related problem that I did manage to solve was one posed by a friend who found it in a list of job interview questions for a job he was applying for.  The question was this:

You roll a die.  You can either take an amount of money equal to the number on the die (so a 5 would get you $5, for example), or you can choose to roll it again.  You can roll it a total of three times - if you choose to roll again the first two times, you have to take whatever you get on the third roll.

So for example, you might roll a 1, choose to roll again; roll a 3, choose to roll again; then roll a 2.  You have to take the $2 because you've used all your rolls.

For another example, you might roll a 2, roll again then roll a 5 and decide to keep it.  So you get $5.

So - over to you.  What should your strategy be to make sure you get the maximum amount of money?

Wednesday, March 2, 2011

I'm still alive!

Wow.  Just when I thought life couldn't get any busier.  Apparently moving takes a lot of time and effort.  As well as helping with a wedding.  And having three jobs.  And (still) doing a PhD.  And playing two gigs in four days - the second of which went four times longer than originally planned o.O

On the upside, we have a shiny new place (now just to unpack, grumble), money is starting to come in, and finally - finally - things are starting to settle into a routine once again.

Of course, now that things are getting less hectic I'm finding more things to fill the time with - Dave, now a married man, is finally getting the chance to get back onto my EP, so hopefully more work will be done on that soon!  And The Solution is back, and will hopefully soon be rehearsing regularly for the next gig, whenever that may be!

Seeing as I don't really have much exciting to show you, I'll show you something tangentially related to what I'm doing at work at the moment.  Reaction-diffusion modelling, which I'm working on now, uses a series of mathematical equations to determine the distributions of things in space - and depending on what you plug into it, some interesting things can happen!  Alan Turing (after whom these Turing Patterns were named) found that the patterns on leopards and jaguars are the result of chemical reactions that are modelled by such reaction-diffusion equations.  It's another example of how maths can - as well as helping us understand how things work - actually be aesthetically pleasing, which I love :)

Wednesday, January 19, 2011

Cribbage (part 1)

Well, as requested on my previous maths post (I won't go so far as to say "by popular demand"), I'm going to do a brief analysis of the game of cribbage.

Cribbage, for the uninitiated, like some variants of poker, involves choosing which card or cards to throw out to maximise the number of points you're likely to get.  You can score points for your hand by having runs, combinations of cards that add up to 15 in value, pairs, three of a kind, four of a kind, flushes, and a strange one-point bonus named "one for his nob" <cough>

The variant of cribbage we'll work with here involves starting with 5 cards, and throwing one out. A single card, the "starter", is then chosen which acts as an extra card for your hand, replacing the one you discarded. Often you'll need to decide whether to take the risk and remove a card which might be useful in the hope that something better will come up as the starter.

Let's say you pick up this hand:

4♠ 4♣ 6♣ K♣ K

So, what do you do?  All you know about are the cards that you picked up, and nothing about what the other player(s) might have.  The starter could be any of the other 47 cards in the deck with equal probability.

If you discard a 4, you'll destroy one of the pairs, losing you 2 of the 4 points already in your hand.  But if the starter comes up 5, it'll score you 11 points.

If you discard a K, you'll again destroy a pair.  But again, if you pick up a 5, you'd score a tasty 14 points!

Finally, if you discard 6♣, you will have two pairs tucked away safely in your hand for 4 points.  However, the best you can do from that point is get an A, which will get you 12 points.

By running through all 47 possible starter cards, we can work out (using the magic of computers!) every possible outcome of each choice.


Discard Minimum Average Maximum
4♠ or 4♣23.6611
6♣45.5312
K♣ or K24.2614

So if you're trying to get as many points as possible, your best option is to discard 6♣ even though the best case scenario is only possible if you discard a K.  Even the option of discarding a 4 is almost as good as discarding a K, even though you can only score a measly 11 points.

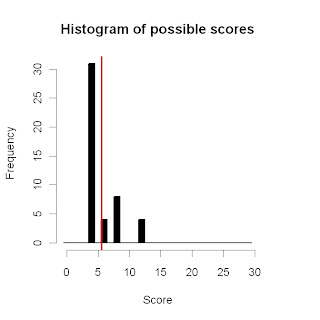
A couple of histograms give a better idea of what is possible.  For 6♣:

Most likely we'll only get 4 points for our hand - but that's the worst we can do, and there is still a small chance of doing better. The red line shows us what'll happen on average, so a little over 5 points.

And for discarding a K:
In this case, we are most likely to get only 2 points, though getting 4 points is also a definite possibility.  Getting any more than that, though, is even more unlikely than if we discarded 6♣.  On average (red line) we won't even score 5 points!

So we see that in this case, the potential benefits are outweighed by the risk.

However, just like in Pass the Pigs, our aim isn't just to rack up as many points as possible - our aim is to win! If our opponent is very nearly at the finish line and we need 14 points to win, then our best option would then be to discard a K, because it's the only way to win the game.  In a situation like that, the utility of the amount of points changes, and near enough is no longer good enough!

Tuesday, December 7, 2010

Pass the Pigs (Part 1)

So it was only a matter of time before maths started appearing in my blog.  But never fear! This shouldn't be too complicated.  If you do get too freaked out, don't worry, you'll be safer in this part of the blog!

A few weeks ago, my better half and I were having dinner with some dear friends, who proceeded to bring out a game called Pass the Pigs (made by Milton Bradley).  Neither of us had ever seen the game before, but we were quickly introduced and proceeded to have a great time playing it.

The idea of the game is that you roll a pair of pigs, and the position the pigs land in determines how many points you get.  You can stop at any time and "pass the pigs" to the next person.  You can also keep rolling and racking up points, but the downside is that if the pigs land in a certain position, you lose all the points you gained that turn.  If the pigs are touching, you lose all the points you have altogether!

The way to win this game is all about knowing when to quit.  As I was playing, I started wondering if people had worked out optimal strategies for winning this game (because I'm a geek).  The answer as I found out later, is of course yesyes, yes, and yes.

If you can't be bothered reading all of that, the general idea is that stopping when you've scored 23 points (or, obviously, when you've won the game) is a good strategy.  The actual very best strategy, if you're only playing against one other person, depends on what your score and their score is.  This makes sense if you think about it - if you've only got 10 points and your opponent has 99 points (the score needed to win is 100), there's no point stopping after 22 points because you know your opponent is very likely to win next turn unless you go all-out.

I decided to try and replicate the results.  First I compared the experimental results in all the literature I could find - what chance each "roll" has of happening.  Fortunately, they all seemed to agree pretty well - the consistency is pretty surprising considering we're talking about mass-produced plastic pigs.

PositionPercentage
Side (no dot)
34.9%
Side (dot)
30.2%
Razorback
22.4%
Trotter
8.8%
Snouter
3.0%
Leaning Jowler
0.61%
from Kern, JC (2006). "Pig Data and Bayesian Inference on Multinomial Probabilities". Journal of Statistics Education 14 (3).


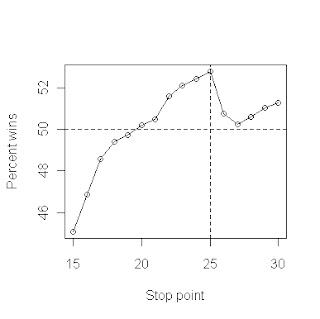
So then, using these probabilities, I simulated what would happen if people with different strategies played against each other.  I ran a round-robin competition in which every strategy from "stop at 15" up to "stop at 30" played against each other in a one-on-one game 40,000 times, taking turns to be first to play.


I found that for the first person to play, being more bold is an advantage - the "stop at 25" strategy wins most often, winning over 52% of their games when playing first (see below).  Not bad, considering that all of the strategies are pretty reasonable competitors.  The reason that boldness works here is because the first player gets an advantage in that they will always have played either as many or one more turn than their opponent.  This means that they can get away with taking more risks.


For the second person to play, alternatively being more shy is better - the "stop at 17" and "stop at 18" strategies do best here, again winning over 52% of their games.  The "stop at 17" strategy actually does slightly better, but to such a small extent (52.225% vs 52.219%) that it makes no difference.


If we combine both sets of results, we see that playing to 23 is the best of the strategies, which agrees with what others have said.


Of course, the next question is what to do when playing against more than one opponent?  This is something that strangely hasn't been brought up by anyone, and is a problem for next time.